Research Protocol
Sweetpotato: Measuring Canopy Cover with ImageJ
Authors: Jessica Weaver1, Laura Schulz1, Jordan White1, Berton Miginigad2, Carol Miles1
Affiliation: 1Washington State University Northwestern Washington Research and Extension Center, Mount Vernon; 2College of Micronesia, Federal States of Micronesia
https://vegetables.wsu.edu/sweetpotato/
December 2025
Introduction
Canopy cover is an important measure of sweetpotato plant growth and development. Canopy cover can be measured throughout the growing season by taking photos of the plants and analyzing them using ImageJ, a software freely available and relatively easy to use. Greater canopy cover may indicate a sweetpotato cultivar can better outcompete weeds. Canopy cover tends to increase throughout the growing season, then decrease slightly near the end of the growing season due to older leaves naturally dying. The ImageJ analysis works well for plots with black plastic mulch, and the color threshold settings described below are for black plastic mulch. For bare soil plots, more complex adjustments to the color threshold settings may be required.
Supplies
- Ruler – for setting the scale in ImageJ
- Meter stick – for ensuring photos are taken at the same height each time
- White board with marker, or white paper – for writing the plot number being photographed
- Cell phone – for taking photos
- Computer with ImageJ software – to measure canopy cover of photos, available for free at imagej
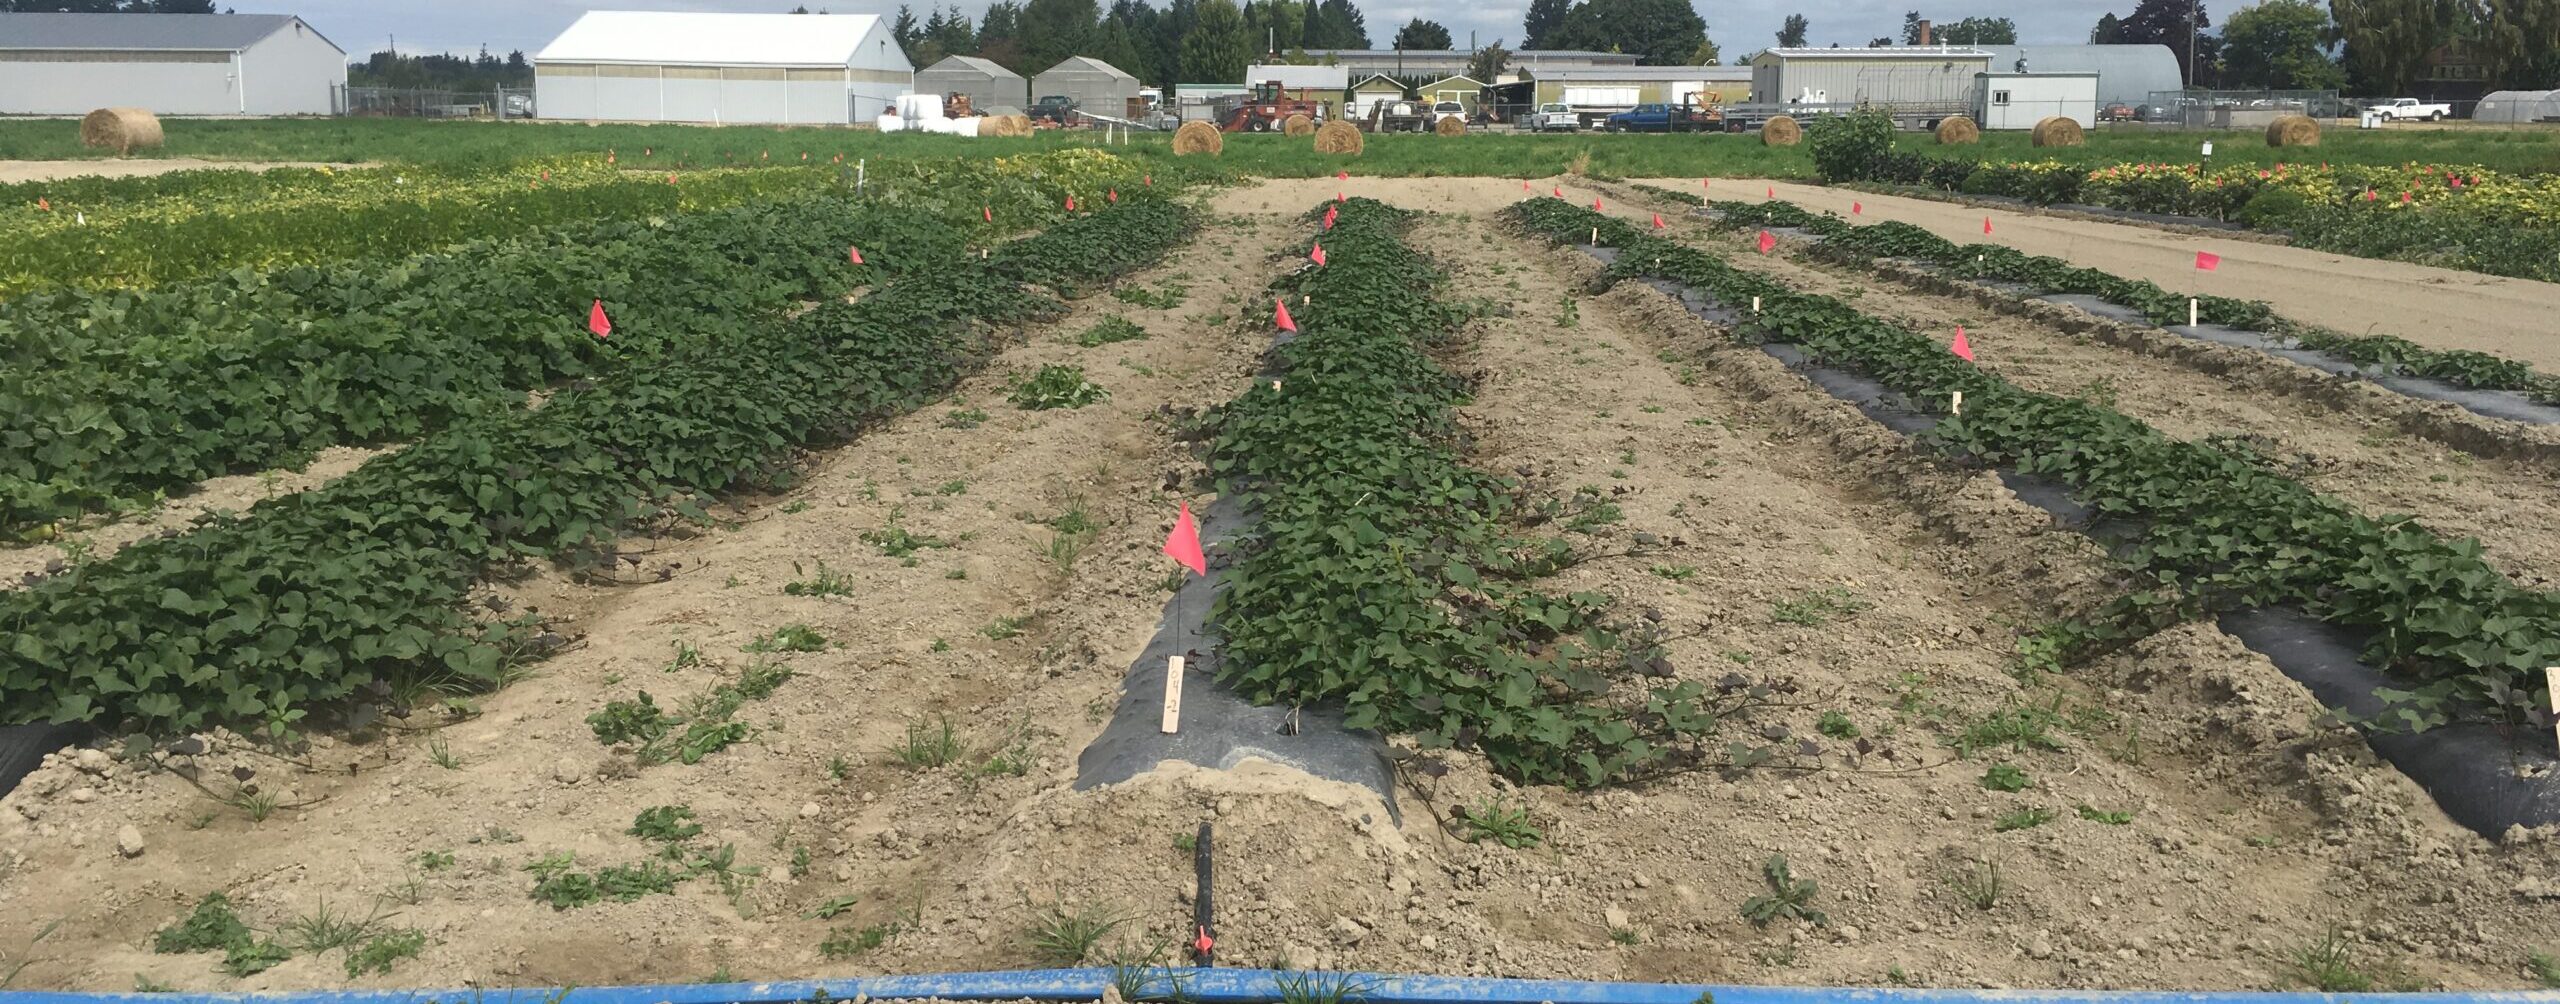
Experimental plot set up
Shortly after planting sweetpotatoes, place two flags to mark the data area in each plot – these plants will be photographed for canopy cover data. Collect canopy cover data from the same size area in the center of each plot; this will be 125 cm row-length when the camera is 1 m above the plot. For example, this will be 6 plants in an experiment with 20 cm (8 inch) spacing, 5 plants for 25 cm (10 inch) spacing, and 4 plants for 30 cm (12 inch) spacing.
In the field
- Pull all weeds in the data collection area, including in the planting holes if grown with mulch, and throughout the row if growing in bare soil.
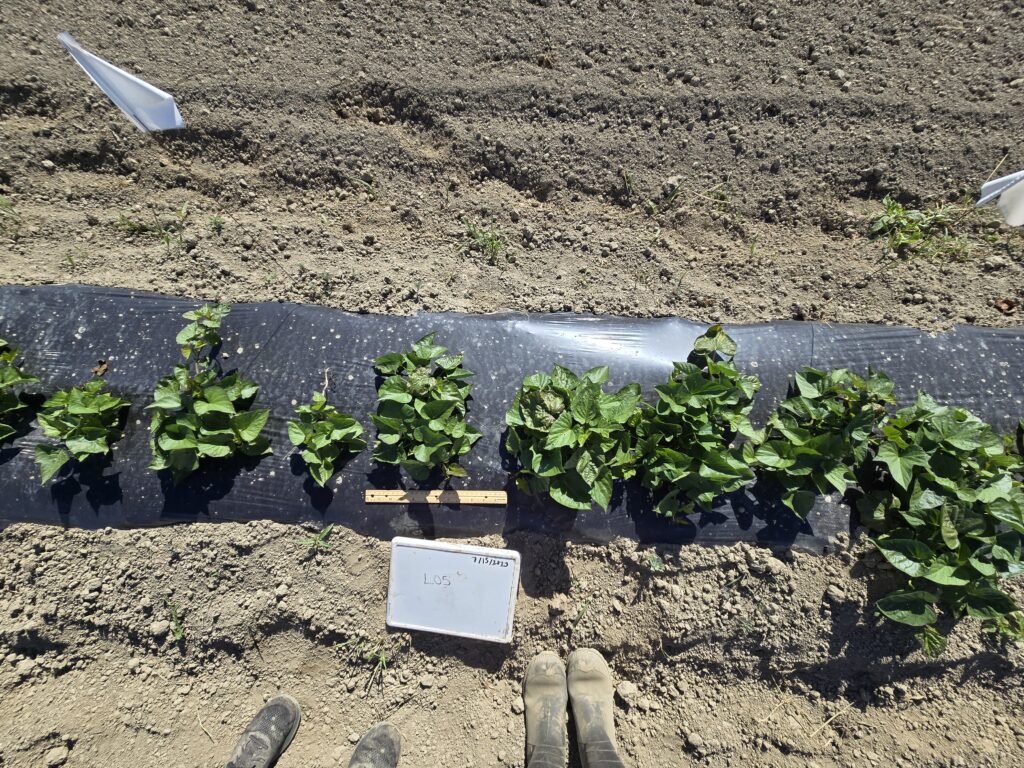
- Place a label, such as a whiteboard or piece of white paper, with the date and plot number on the edge of the row or bed so it is in the photo, but not in the data collection area.
- Place a ruler next to the center plant in the data collection area. This will be used to calibrate the ImageJ software. This only needs to be done for the first photo.
- Use a meter or yard stick to set the distance above the soil for each photo and place the phone at this height. Remove the meter stick, hold phone stationary and take a photo from 1 meter above the soil (Figure 1).
On the computer
- Rename all photos so they have identifying file names. Use the naming convention “YYYY.MM.DD_[Trial Name] _[Plot Number]”. For example, “2025.07.15_Variety_L05”.
- Crop all photos to the edges of the black plastic mulch or edges of the bed, if mulch is not used (Figure 2). Optionally, flags can be used to demarcate data collection area.
ImageJ analysis
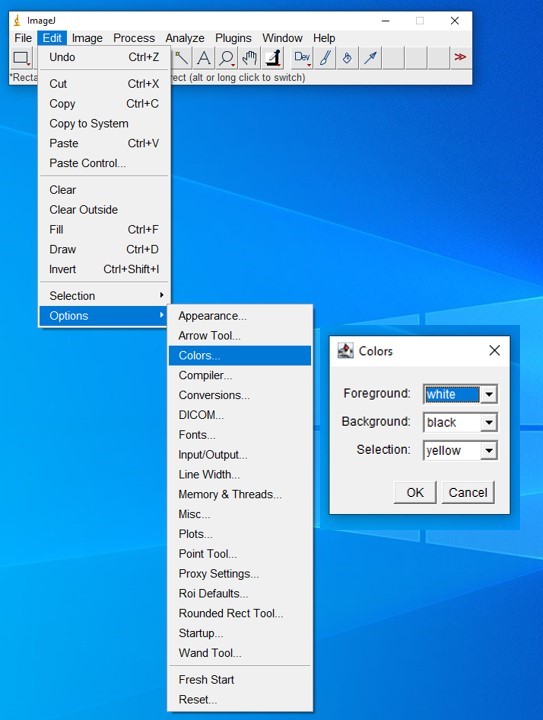
- Open ImageJ. Make sure ImageJ is set up correctly; you only need to do this for the first photo in each session. To set up;
- Go to “Edit” –> “Options” –> “Colors” and set the foreground color as white and the background color as black (Figure 3).
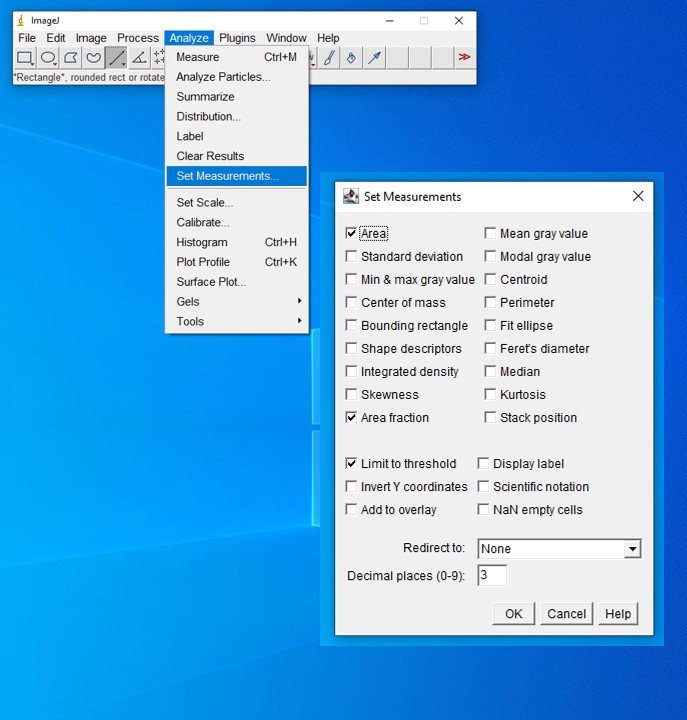
- Go to “Analyze” –> “Set Measurements” and make sure only the following are selected: Area, Area Fraction, Limit to Threshold (Figure 4).
- Open your first photo in ImageJ by clicking on “File” –> “Open” and select the photo you want to start with.
- Using this photo, set the scale; you only need to do this for the first photo in each session.
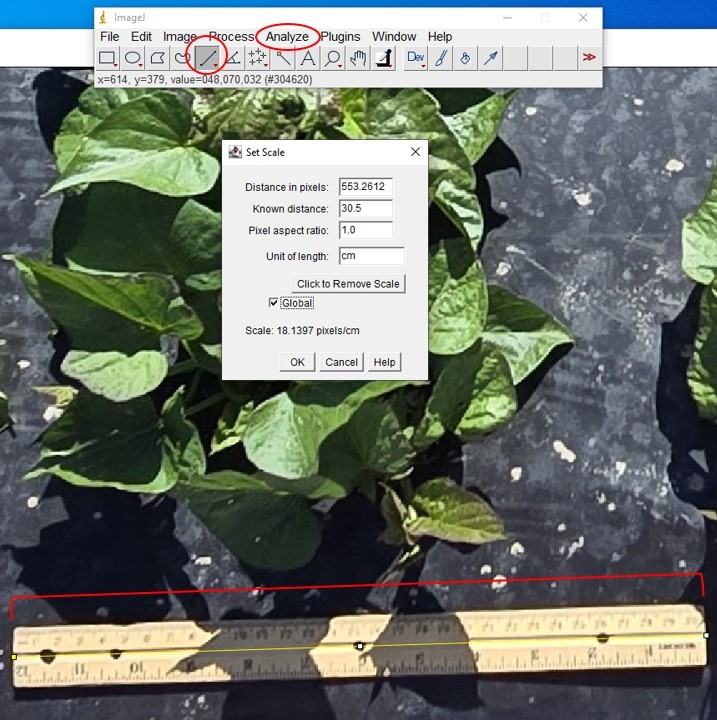
- Set the scale by clicking on the straight-line icon along the top bar, then clicking and dragging to make a line along the edge of the ruler.
- You may need to zoom in (Image –> Zoom –> In) to make sure you are drawing the line exactly along a known area of the ruler (e.g. 30 cm).
- Click on “Analyze” –> “Set Scale” and for known distance, type in the length you drew the line across (e.g. 30) and under unit put “cm”. Make sure “Global” is checked (Figure 5). Click “OK”.
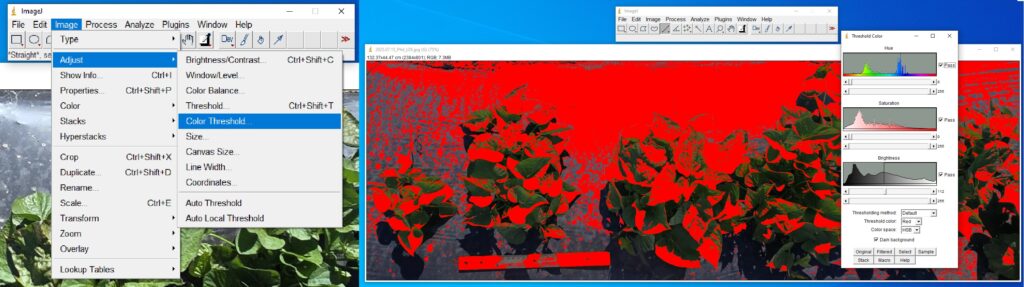
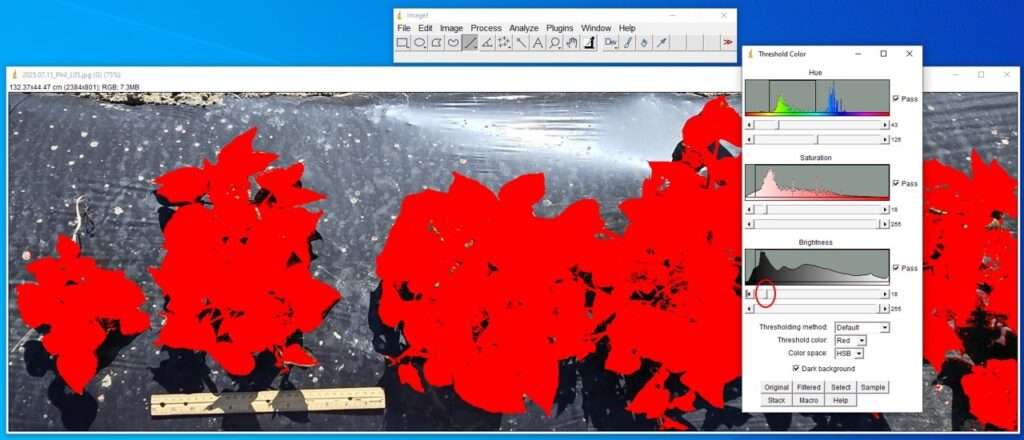
- Click on “Image” –> “Adjust” –> “Color Threshold”. You will want to adjust the sliders until only the sweetpotato plants are covered in red (Figure 6).
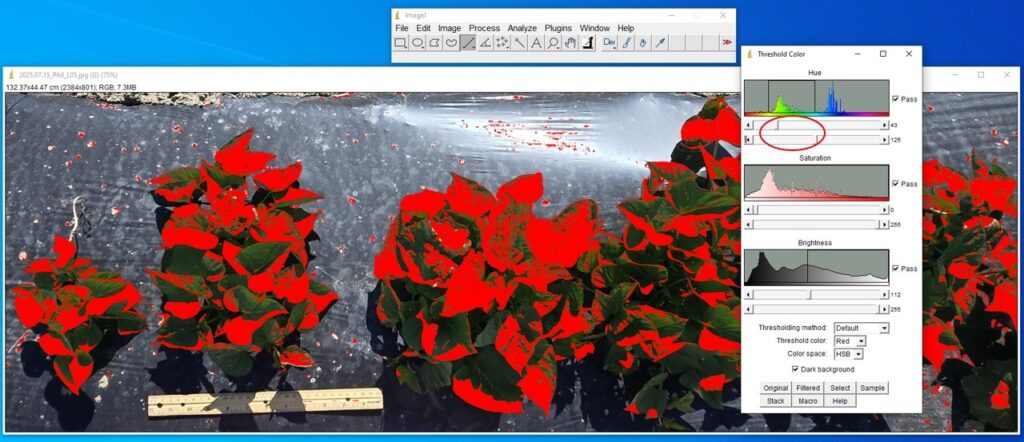
- Increase the first slider under “Hue” until the ruler is no longer shaded with the ImageJ red. Then decrease the second bar under “Hue” most of the way until much of the background is no longer shaded red, but not so much that the leaves become less shaded (Figure 7).
- Increase the first bar under “Saturation” until the remaining highlights on the mulch in the background are no longer included, but not so much that the highlights on the leaves are excluded (Figure 8).
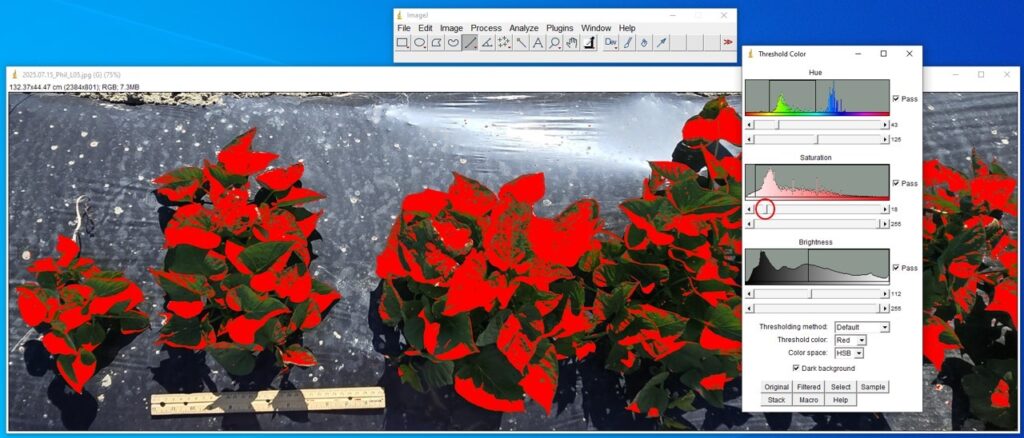
- Decrease the first bar under “Brightness” until the leaves are almost completely shaded, but not so much that the soil in the holes or shadows of the leaves are shaded (Figure 9).
- For bare soil photos: Click “Process” –> “Binary” –> “Convert to Mask”. Use the paint brush tool to exclude weeds or unnecessary particles.
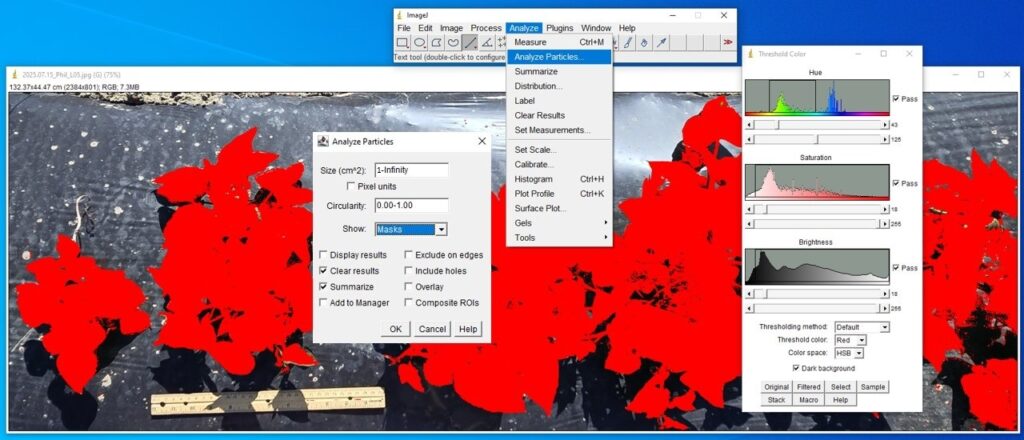
- Click on “Analyze” –> “Analyze particles”.
- Set the size to “1–1000” for very small plants or “1–Infinity” for larger plants.
- Check “clear results” and “summarize”.
- If there are any remaining areas touching the edges of the photo that are shaded but shouldn’t be, check ‘Exclude edges”. However, if any plants are touching the edge of the photo, make sure “exclude edges” is not checked so that those plants will be included.
- Click “include holes” if there are spots in the middle of the leaves that are not shaded but should be.
- Make sure “masks” is selected next to “Show”. Then click “OK” (Figure 10).
- A shaded image of the included areas will pop up. Make sure there are no extra spots shaded and the shading is accurately covering the plants. If these issues occur, go back and continue adjusting the threshold color settings or the Analyze particle settings. For example, to get rid of small spots that shouldn’t be shaded, try increasing the lower bound of the size range. A summary box will pop up that shows the total and % Area (Figure 11).
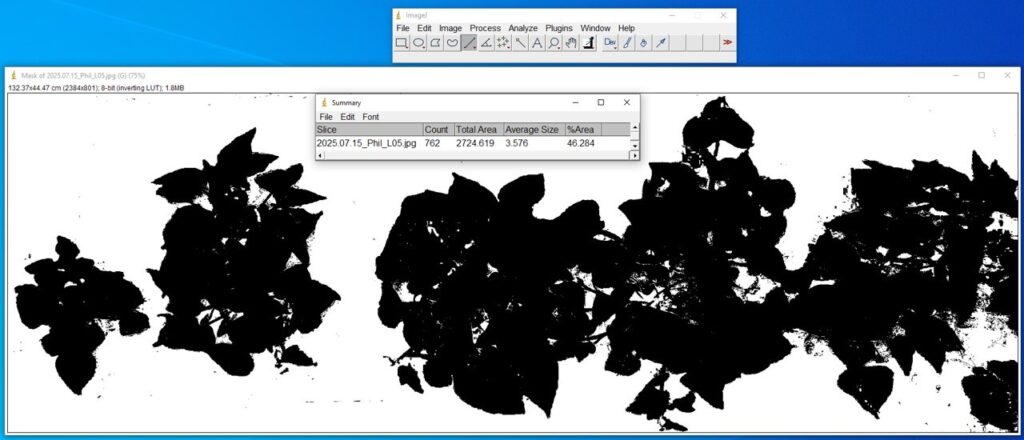
- Do not close the summary box. All your measurements will show up in this box and they can be conveniently downloaded as an excel file under “File” –> “Save as”.
- Open the next photo and repeat steps 10–16.

The information in this publication is based upon work that is supported by the U.S. Department of Agriculture, National Institute of Food and Agriculture, under award number G200-25-WB305 through the Western Sustainable Agriculture Research and Education Program under project number WPDP25-003, and Hatch Project WNP0010 Accession 7005372. Any opinions, findings, conclusions, or recommendations expressed in this publication are those of the author(s) and should not be construed to represent any official USDA or U.S. Government determination or policy, and are not meant to endorse any businesses or detract from any not listed.